

Plenty of Shopify stores have spent months pouring money into Meta Ads, Google, and TikTok to drive new traffic. Acquisition isn't the problem. The problem is that none of that effort sticks. Customers show up, buy once, and disappear. The budget keeps burning.
Retention isn't the glamorous part of ecommerce. But it's the part that makes everything else profitable. Here are the metrics you need on your radar and what they actually tell you.
Why retention beats acquisition (by the numbers)
Acquiring a new customer costs five to seven times more than retaining an existing one. That's not a textbook stat. It's what most DTC operators see when they break down their real CAC. And yet 80% of budget still goes to prospecting.
The mechanics are simple. A customer who already bought from you knows the product, trusts the shipping, and doesn't need three touchpoints to convert. Their marginal cost of conversion is close to zero. Every euro you spend retaining them delivers a structurally better return than the euro you spend attracting someone new.
That said, retention without clear metrics is just intuition. And intuition doesn't scale.
Customer Lifetime Value (LTV): the north-star metric
LTV is the total revenue a customer generates over their relationship with your store. It's the metric that puts everything else, including your CAC, into perspective.
The basic formula is straightforward:
- LTV = Average order value × Annual purchase frequency × Customer lifespan in years
If your average order is 60 euros, the customer buys twice a year, and stays active for two years, their LTV is 240 euros. If your CAC is 35 euros, your LTV:CAC ratio is nearly 7:1, a healthy business. If CAC climbs to 80 euros with the same LTV, you're in dangerous territory.
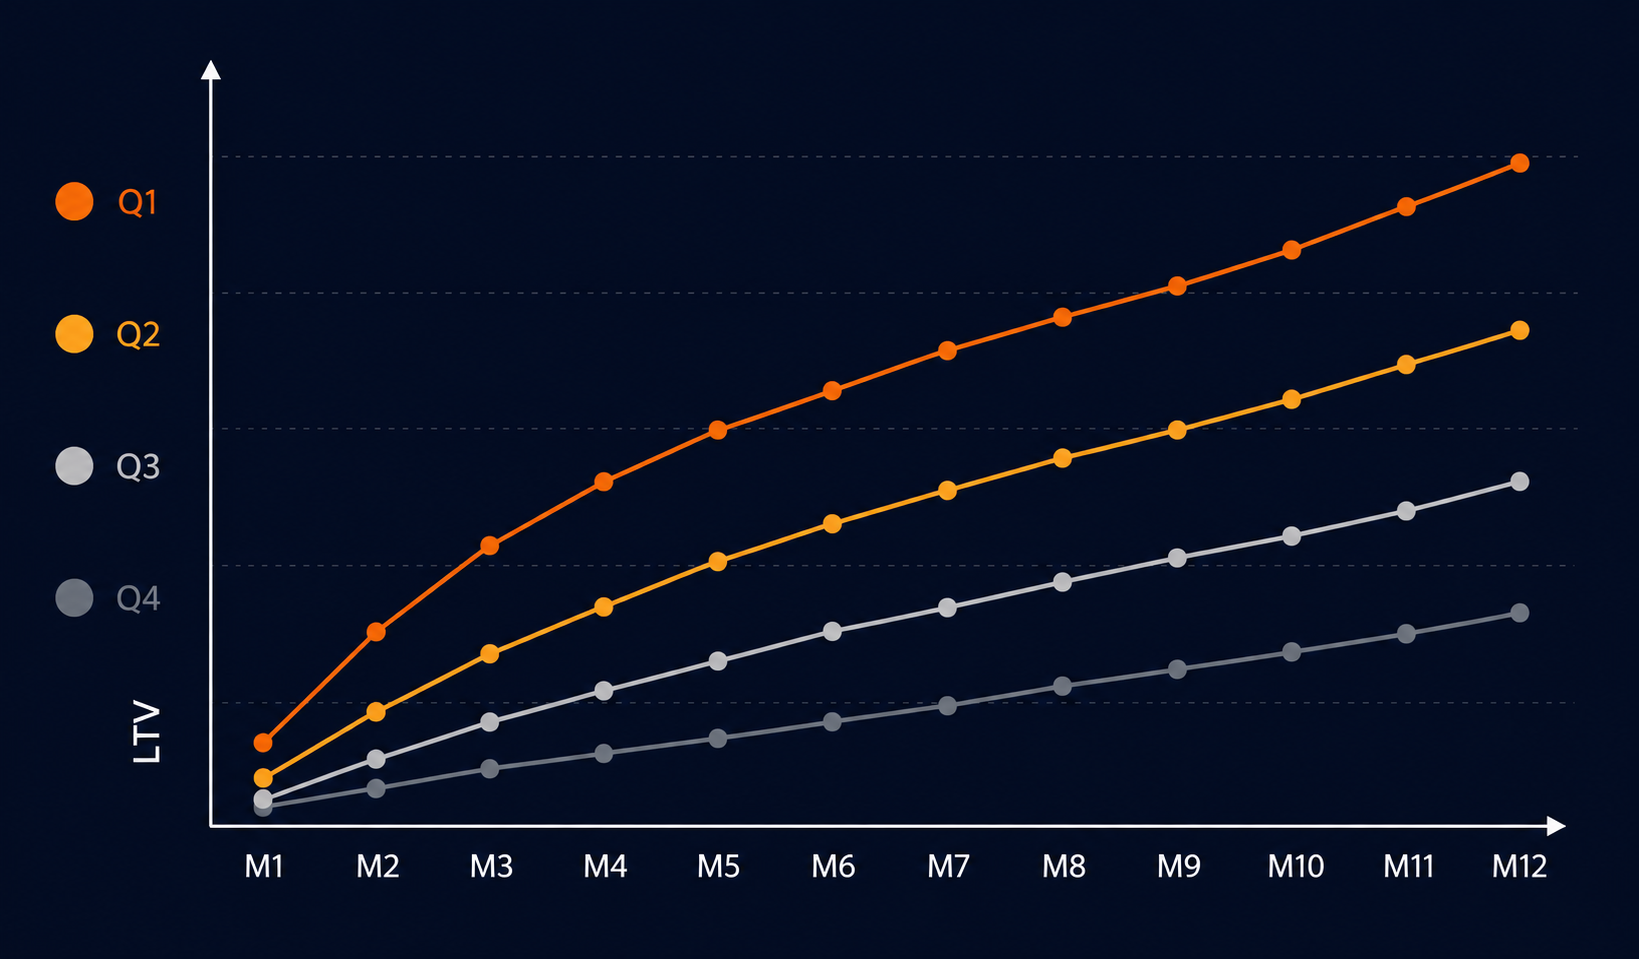
What matters isn't LTV in the abstract, but its trend. If it climbs quarter over quarter, your retention efforts are working. If it drops, something in the post-purchase experience is broken.
Repeat Purchase Rate: how many come back?
The Repeat Purchase Rate (RPR) measures the percentage of customers who've made more than one purchase in a given period. It's the most direct way to know whether your customer base has a repurchase habit or whether your store functions as a one-time-visit trap.
A healthy RPR for DTC ecommerce usually sits between 25% and 40%, though it varies widely by category. Consumables and food can exceed 50%. For fashion or home decor, staying around 20% is already reasonable.
If you can only watch one metric this week, make it your repeat purchase rate. Everything else can be rebuilt. Without repeat purchases, there's no sustainable business.
Calculate RPR monthly and break it down by acquisition channel. Sometimes you'll find that email customers have an RPR of 38% while paid social customers sit at 14%. That changes how you allocate budget.
Cohort analysis: seeing behavior over time
A cohort is a group of customers who made their first purchase in the same period, say January 2025. Cohort analysis shows you how many of them bought again in month 1, month 3, month 6, and so on.
What cohort analysis reveals that an aggregate metric hides:
- Whether an acquisition campaign brought in higher- or lower-quality customers long-term.
- Whether a change in product, packaging, or customer service improved retention from a specific date onward.
- The exact point where activity drops off most sharply, and where to step in with automations.
Shopify Analytics includes a basic cohort view. For more detail, tools like Lifetimely or Triple Whale let you slice the data by channel, product, or geography.
Churn and its hidden cost (voluntary vs. involuntary)
Churn is the rate at which you lose active customers. In non-subscription DTC ecommerce, it's usually defined as the percentage of customers who haven't bought again in the last 90, 180, or 365 days, depending on the product's expected purchase frequency.
Voluntary churn
The customer decided not to come back. It could be price, experience, a competitor, or simply not needing the product anymore. Here, exit surveys and well-segmented winback flows are your best tool.
Involuntary churn
The customer would have come back, but something technical got in the way: an expired card, a failed recurring payment, an invalid email address. This type of churn is especially fixable and often gets ignored. Reviewing payment declines and turning on automatic dunning can recover between 10% and 20% of that lost revenue with zero acquisition cost.
Involuntary churn: money on the floor
Review failed payment orders monthly. An active recovery flow can bring back between 10% and 20% of that revenue without spending a euro on acquisition.
Time Between Orders: the repurchase clock
The Time Between Orders (TBO) is the average interval between the first and second purchase, and between subsequent purchases. It tells you when to expect the next purchase and, therefore, the optimal moment to reach out.
If your store's average TBO is 45 days, sending a reactivation email on day 50 makes far more sense than waiting until day 90, by which point the customer has already found an alternative. This data feeds directly into how you configure your winback and replenishment flows. If you don't know your TBO, you're sending emails blind.
Calculate TBO by product category. A customer buying kitchen consumables has a very different rhythm than one who bought a lamp. Treating them the same wastes the communication.
From metrics to levers: what to do with the data
Metrics without action are just pretty dashboards. What matters is the loop: measure, interpret, act.
- Low RPR: Turn on or review your post-purchase email flows. The problem usually sits in the first 60 days.
- Stalled LTV: Revisit your bundles and upsells strategy. Average order value is a direct lever on LTV.
- High TBO with no replenishment flow: Set up triggers based on the historical interval, not fixed dates.
- Cohorts that decline over time: Investigate whether the issue is the product, expectations set by the ad, or the delivery experience.
- High involuntary churn: Implement native dunning in Shopify or via apps like Recharge if you run subscriptions.
A good decision-focused dashboard brings these metrics together in one view. Without it, analysis becomes manual and gets abandoned within two weeks.
If your store doesn't have these numbers figured out yet, or you have them but aren't sure what to move first, tell us where you're at and we'll figure it out together.

Juan Jüncter
Founder & Operator · ReadyCart
Founder of ReadyCart. Builds Shopify stores, runs Google and Meta spend, and sets up the measurement that makes every decision verifiable.
Work with ReadyCart

Get tactics like this every week
Practical content for Shopify brand owners who want to grow with strategy, not luck.